Prognóstico
Forecasting helps you visualize your project’s progress based on tracked time. See how you’ve performed on recurring projects for a set time period and make predictions based on scheduled assignments and add estimates or budget to see if the project will go over or under them.
O prognóstico é uma ferramenta extra, disponível apenas para administradores. Você pode ativá-lo atualizando seu espaço de trabalho para o plano Pro ou Enterprise.
Criando gráfico #
- Vá para a página Projetos na barra lateral
- Escolha a guia Prognóstico
- Escolha uma data ou um período de tempo no futuro
Cada ponto no eixo X mostrará o valor do período de tempo específico que você escolheu (dia, semana, mês).

Dia: o valor no eixo x está em dias e cada ponto na curva mostra o valor por dia.
Semana: O valor no eixo x mostra toda a semana para cada ponto.
Mês: O valor no eixo x mostra o mês inteiro para cada ponto.
Prognosticando a conclusão do projeto #
O gráfico mostra a conclusão do projeto com base nas estimativas e horas que já foram registradas.
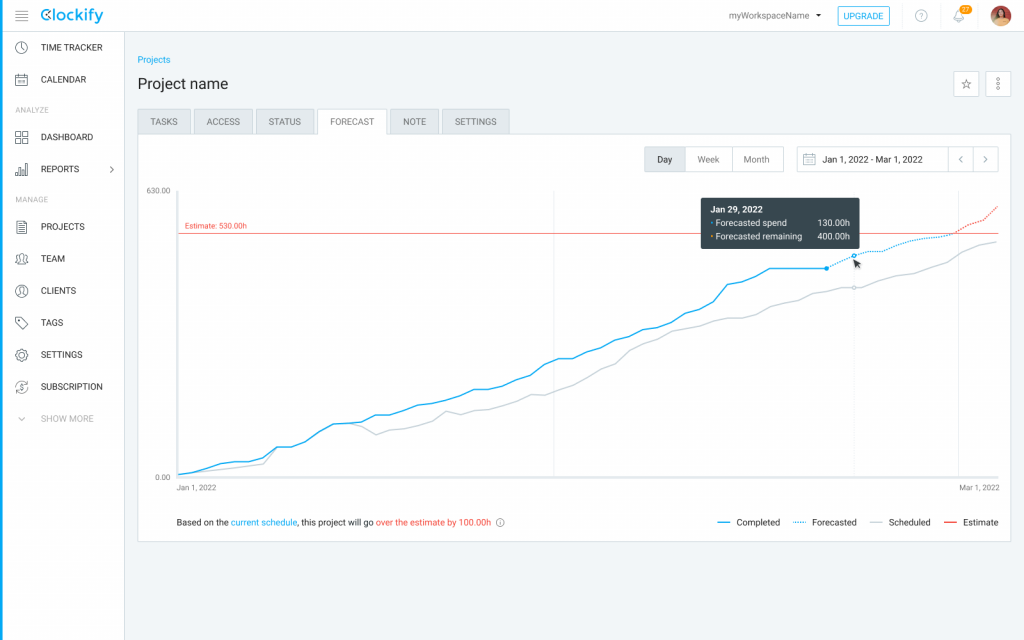
Concluída (linha azul sólida)
Mostra as tarefas concluídas com base no tempo rastreado faturável até o momento, ou seja, tudo concluído até o dia atual.
If estimate reset is turned on, first point is 0, but last point is set in defined period (week, month, year).
Prevista (linha azul pontilhada)
Shows completed tasks based on billable tracked time plus future scheduled billable time. It starts with Today, which means that the Forecasted curve starts where the Completed curve ends. If it goes over the estimated horizontal line, the part of the curve that is over the estimate will be in red.
If estimate reset is turned on, first and last point are set in defined period (week, month, year).
Planejada (linha cinza contínua)
Mostra as tarefas concluídas com base nas horas faturáveis agendadas neste projeto. Essa curva está conectada ao recurso Planejador e recebe atribuições de agendamento para o valor do eixo Y (número de horas agendadas).
If estimate reset is turned on, then first and last point of the line need to be in the defined period (week, month, year).
Estimativa (linha cinza sólida ou linha vermelha sólida se os projetos ultrapassarem a estimativa)
Shows completed tasks based on estimate in project settings.
If estimate reset is turned on, then first and last point are in the defined period (week, month, year).
If project estimate reset is set on a specific time of the day:
- entries and assignments are always placed based on their start time: e.g. Weekly reset is set for today, 2pm. Assignment is scheduled from 12pm-6pm. The assignment is assigned to the first half of the day, which belongs to the previous week. This week’s time range is from 2pm today to midnight and there is no assignment in that period.
- midnight is automatically assigned if assignment doesn’t have start time (belongs to the first part of the day)
- today’s dot on the chart always belongs to the Forecasted line: e.g. Estimate reset is set to 2pm, so the first part of the day belongs to the previous week, however, it will still have a forecasted value for that dot until today is over
Se semana/mês for selecionado no seletor de período e Hoje for incluído no período selecionado, tudo até Hoje será concluído e tudo depois de Hoje, até o final da semana/mês será Planejado. Portanto, as horas rastreadas de Hoje serão incluídas no total de tarefas Concluídas após a meia-noite, em seu fuso horário.