Key Performance Indicators (KPI): Why and how to set them, plus KPIs in Excel tutorial
Last updated on: November 22, 2023
In general terms, Key Performance Indicators (KPI) are the crucial indicators of the progress you are making towards a specific objective.
In this article, you’ll learn the following information that will help you grasp the concept of Key Performance Indicators and inspire you to consider how best to define them in your own organization:
- What are Key Performance Indicators (KPI), in simple terms and in more detail?
- What is the purpose of KPIs?
- What are the benefits of KPIs?
- How do you set your own KPIs (and track and measure them from an Excel dashboard)?
- And, finally, what are some KPI examples you can use as inspiration when defining your own performance indicators?

Table of contents
What is a KPI, in simple terms?
In the simplest terms, Key Performance Indicators (KPIs) represent a way of measuring how individuals, teams, or entire companies are performing compared to the objectives they have to reach.
To help grasp the concept, let’s look at a simple, illustrative example:
Imagine a ship sailing from Hull to Amsterdam.
The ship is expected to carry its passengers and cargo to the destination in 12 hours.
Throughout the voyage, the captain and crew will need to keep an eye on:
- the weather information
- the state of the sea
- the friction of the water
- the ship’s fuel levels
- the ship’s average speed
The listed components are all KPIs — they will help the captain and the crew understand whether the voyage is progressing as planned, or whether they need to make some adjustments:
- to their plan (such as move the expected time of arrival forward due to rainy weather)
- to the KPIs they have control of (such as refill the ship’s fuel levels, or speed up)
What is a KPI, in more detail?
Adding more detail to the Key Performance Indicator definition, they are usually described as quantifiable performance measurements that indicate how well an organization is progressing towards a predefined business objective.
We recognize 2 main divisions in terms of the types of Key Performance Indicators, based on:
- Who they apply to
- How they help contribute to an organization
The division of KPIs based on who they apply to
According to this first division, we typically distinguish between 2 types of Key Performance Indicators, based on the different levels of organization they apply to:
- High-level KPIs — they track the overall performance of the organization
- Low-level KPIs — they track the performance of separate organization departments, such as marketing, sales, human resources, development, etc.
The division of KPIs based on how they help contribute to an organization
According to this second division, we distinguish between 5 different types of Key Performance Indicators, based on how they help contribute to an organization: Input, Output, Process, Project, and Outcome KPIs.
Let’s illustrate each type based on an example of a trendy tea bar you’re running.
1. Input KPIs — They measure the amounts, type, and quality of resource attributes needed to produce certain outputs.
For example, these performance indicators may be the:
- efficiency of the suppliers who supply you with different types of tea
- quality of the tea
- quality of the storage rooms where you keep the tea
- water and other bills
- cost of employees who work in your tea bar
2. Output KPIs — They measure what is produced as a result of Input KPIs.
For example, these performance indicators may be the:
- taste of the tea
- temperature of the tea
- strength of the tea
3. Process KPIs — They measure the quality and efficiency of equipment and processes involved in the production of certain outputs.
For example, these performance indicators may be the:
- efficiency of the equipment used to make the tea
- efficiency of the tea-making procedure
4. Project KPIs — They measure and track the status of deliverables and the progress towards milestones in projects.
For example, these performance indicators may be the:
- marketing campaign that advertises your tea bar
5. Outcome KPIs — They measure the accomplishments that come from your efforts towards an objective.
There are 2 sub-types of these performance indicators:
- Intermediate outcome KPIs (e.g. establishing better brand awareness)
- End outcome KPIs (e.g. establishing a higher level of customer satisfaction as a result of the better brand awareness)
What is the purpose of a KPI?
The main purpose of Key Performance Indicators is to show exactly where your organization stands when compared to what you want to accomplish:
- Are you on track?
- Are you lagging behind?
- Are you ahead?
For example, say that your goal is to reach a total of 50,000 pageviews on your blog 6 months after first going live.
The first 4 months pass, and you find that you have only reached 5,000 pageviews during this time.
By simply glancing at these numbers, you’ll know that you are lagging behind with what you want to accomplish, and that you need to assess your work and make plans for the future accordingly (e.g. change your strategy, lower your expectations, or simply work harder).
If you attach certain Key Performance Indicators to all your business objectives, you’ll make it easy to track and assess them in this easy manner as often as you’d like, and change your approach to work accordingly.
What are the benefits of setting KPIs?
Key Performance Indicators have several vital benefits for an organization:
✓ They clarify the current position of an organization and the expectations in terms of future performance.
✓ They serve as a point of reference you can use to compare past and present performance and draw apt conclusions for the future.
✓ They outline what is important in a business, thus helping employees focus on achieving this.
✓ They imply a consistent approach you need to implement in order to achieve a goal.
✓ They increase employee engagement and motivate them to pursue the goal.
✓ They make employees more accountable with their work by illustrating what represents a good performance and what represents underperformance.
✓ They help maximize resource use and eliminate inefficiencies.
✓ Employees feel better connected with the company’s purpose.
How do you set KPIs? An eleven-step guide

Now that you understand what Key Performance Indicators are and why they’re important for reaching business objectives, let’s see how you can best set them for your organization, teams, and departments.
1. Define relevant objectives for your KPIs
First, before you even start thinking about your performance indicators, consider and define the precise business objectives you’ll link them to.
Make sure that these objectives are important for the success of your own business, not just random goals you copied from a famous company you look up to for inspiration.
Remember, unless your chosen objectives are relevant to your own organization, you’ll either be achieving nothing with your efforts, or worse, wasting time and money.
2. Decide how many KPIs should you have
Now that you’ve ensured your company objectives are relevant and clear, it’s time to decide how many performance indicators you’ll want to attach to them.
Stacey Barr, a Performance Measure Specialist, suggests no more than three KPIs per goal in her article at The KPILibrary, in a 3-step process that’s easy to follow:
Step 1: Link your goals with your KPIs
Each performance measurement should serve as a means to get to a certain goal, and should, as such, be connected to that goal. All KPIs that don’t serve as a means towards a specific goal are KPIs you should eliminate.
Step 2: Choose your 3 priority goals
If you’re looking to achieve excellence with your goals (which is usually the case), then 3 goals are the maximum you should set at a time. Once you’re done with your first 3 most important goals, you can shift your focus to another set of goals.
Step 3: Set no more than 3 KPIs for each priority goal
If a goal needs only 1 KPI, then you’re on an excellent start. However, in case you need more than 1 KPI to measure your success towards a goal, then a maximum of 3 KPIs is optimal for you to stay focused. In line with that, it’s best that you track no more than 9 Key Performance Indicators at a time (3 goals x 3 KPIs at maximum).
3. Define the components of your KPIs
Now that you understand the maximum of KPIs you should have, it’s time to think about the 4 main components you’ll need to consider when setting any KPI: its Measure, Data Source, Target, and Frequency.
Step 1: Choose the KPI Measure
The KPI Measure clarifies what you want to measure and how you can measure it.
For example, the measure you may want to track can be the traffic that comes to your website.
Step 2: Choose the KPI Data Source
The KPI Data Source clarifies how you will be gathering the data you need to track and analyze your desired KPIs. For this purpose, you will likely find great value in specific software, depending on what exactly you want to track and analyze.
For example, to track the traffic to come to your website, you can use Google Analytics.
💡 To choose the software to use as a data source for your KPIs, you can also look for inspiration in our previous blog posts, depending on what you want to track and measure:
Step 3: Define the KPI Frequency
The KPI Frequency clarifies how often you are going to pull data from your KPI Data Source and review your performance indicators. This frequency can be on a daily, weekly, monthly, or yearly basis, depending on your business type and the nature of the Key Performance Indicators you’re measuring.
For example, you can pull and compare the data about the traffic that comes to your website in Google Analytics on a monthly basis.
Step 4: Define the KPI Target
The KPI Target represents the desired value you want to achieve.
For example, the traffic target you may want to reach can be 20,000 viewers on a monthly basis.
Make sure your KPIs are well-defined and S.M.A.R.T.
When defining your Key Performance Indicators and its targets, make sure they are well-defined and in line with the S.M.A.R.T. criteria.
Well-defined Key Performance Indicators are those that are:
- Well-researched, i.e. they are based on feedback from analysts, managers, and department heads who are capable of identifying relevant KPIs.
- Objective, i.e. they are capable of providing clear, objective evidence of progress.
- Well-targeted, i.e. they measure exactly what they are supposed to measure.
- Comparable, i.e. it’s possible to track how performance levels change over time.
- Well-directed, i.e. they track at least 1 of the following parameters: team efficiency, work. quality, project performance, personnel performance, speed, compliance, utilization of resources, or economics.
- Balanced, i.e. they represent a balance between the lagging and leading indicators.
S.M.A.R.T. KPIs are those that are:
- Specific, i.e. clearly defined, straightforward, and precise.
- Measurable, i.e. it’s possible to measure progress towards a goal with them.
- Attainable, i.e. it’s an attainable performance indicator for your business.
- Relevant, i.e. it’s relevant for your business.
- Time-bound, i.e. there is a specific time frame within which you want to accomplish the goal related to the performance indicator.
5. Answer the basics for each KPI
To make sure your KPIs are defined in accordance with critical (key) business objectives, answer the following questions for each:
Q1: What is the outcome you want to achieve?
Q2: Why is this outcome important?
Q3: How can you have an influence on this outcome?
Q4: Who is responsible for the outcome?
Q5: How are you going to measure progress towards the said outcome?
Q6: How will you know you have achieved the outcome?
Q7: How often will you review your progress towards the outcome?
Here’s an example of a KPI you’ve defined by answering these questions:
“I want to increase sales revenue by 10% in the first quarter of the year.”
A1: Increasing revenue by 10% in the first quarter of the year.
A2: The business will become more profitable.
A3: By reaching out to new customers and having existing customers buy more products.
A4: The Sales Team Leader will be responsible for this KPI.
A5: An increase in money customers spend on our products will mean progress.
A6: Revenue will increase by 10% in the first quarter of the year.
A7: The progress will be reviewed on a biweekly basis.
6. Set short-term KPIs to complement your long-term KPIs
Your long-term Key Performance Indicator is the overall vision of your strategy, i.e. your main target. In order to reach that main target, you’ll also need to pursue several relevant short-term targets.
For example, say you want your company to earn revenue in the amount of $150,000 within the first 6 months of its existence (say you started working in June). This is your long-term KPI target.
In order to reach it, you should go one step at a time, and reach a certain revenue figure each month. So, to reach $150,000 from June to December, you should earn revenue in the amount of $25,000 per month. These are your short-term KPI targets for each month.
If you manage to gain revenue in the amount of $25,000 per month during the first 3 months, this is a good indication that you will also reach your long-term KPI target by the end of December.
However, if you are falling short of $25,000 for the first 3 months in a row, perhaps it’s time to rethink your long-term KPI target (e.g. prolong it to 9 months, or decrease the total revenue you want to reach in the same time period).
This actually brings us to the next point, i.e. to how you can approach improving your performance.
7. Support your KPIs with OKRs
Objectives and Key Results (OKRs) is a popular performance, goal management, and strategic framework that is often confused with Key Performance Indicators.
But, in truth, they are actually two separate frameworks that should be used to complement each other.
The main difference is that Key Performance Indicators measure the process of your efforts, while Objectives and Key Results measure the outcome of your efforts.
In line with that, your KPIs may keep you in check about your goals and measure performance over time, but your OKRs will align your company’s priorities and measure your progress towards your goals over time.
Your OKRs can also help you improve performance on your KPIs, once you realize you are not reaching your targets.
For example, you have a Key Performance Indicator target to reply to each support ticket in 15 minutes. But, your real-time time tracking results show it actually takes you 20 minutes to do so. In light of this knowledge, you can define the following Key Result to encourage you to improve your performance: “I will decrease the amount of time I spend on one support ticket from 20 minutes to 15 minutes within two weeks.”
8. Make sure you communicate the KPIs well
Now that you understand how to create efficient Key Performance Indicators and obtain the data to set these KPIs into motion, you’ll need to make sure they are clear, straightforward, and easy to understand by all relevant parties.
So, make sure you always provide context to your employees and stakeholders about the Key Performance Indicators you find relevant in your organization:
- explain why you are measuring this type of indicator, and not another type (e.g. sales-related KPIs instead of HR-related KPIs)
- explain why you are measuring this particular indicator, and not another one (e.g. sales per rep instead of sales per department)
Always make sure you answer all your employees’ and stakeholders’ questions — if a lot of people are asking why certain KPIs are being pursued instead of other KPIs, that’s a sign that you are likely undercommunicating the relevance and importance of the chosen KPIs, and need to work on your approach.
Here’s another reason why you should make sure you communicate your Key Performance Indicators well — the better employees and stakeholders understand the chosen KPIs and why they are being pursued in the first place, the better insights they will be able to offer, and the more relevant and potentially efficient your KPIs will become as a result of their suggestions.
9. Create a KPI dashboard in Excel
Creating a Key Performance Indicators dashboard in Excel can be a great and easy way to track your performance against relevant KPI targets.
But, how do you create a KPI dashboard in Excel?
Well, there are several methods and YouTube tutorials you can use for inspiration, and here’s one easy and efficient tutorial about creating and analyzing such a dashboard, made by Dr. Eugene F.M. O’Loughlin, Lecturer in Computing at the National College of Ireland:
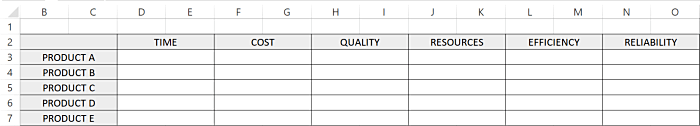
Step 1: Define the KPIs you want to measure (and what you want to measure against them)
In the tutorial example, Dr. O’Loughlin uses the 6 Key Performance Indicators he has previously defined in his book An Introduction to Business Analysis: Problem Solving Techniques and Strategies:
- Time
- Cost
- Quality
- Resources
- Efficiency
- Reliability
In the example, he uses these performance indicators to track the performance of products.
But, you can enter whatever you want to analyze instead of products. You can also implement different Key Performance Indicators.
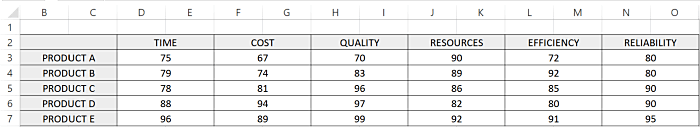
Step 2: Add the values for each element you want to measure against your KPIs
In the example from the tutorial, these elements are products measured against the KPIs of Time, Cost, Quality, Resources, Efficiency, Reliability. Add the values you think each product deserves, for all 6 listed KPIs.
For example, you can add a number from 0 to 100 to score the performance of a product.
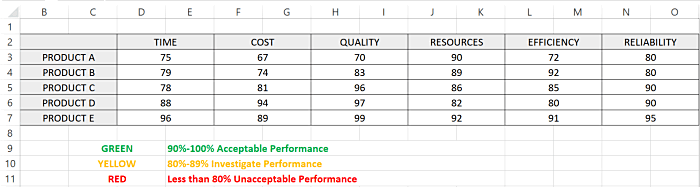
Step 3: Define what each value means
Now that you have the KPI values next to each product, it’s time that you define how you will measure performance:
- What values will mean you have an acceptable performance?
- What values will mean you need to investigate performance?
- What values will mean you have an unacceptable performance?
The scores for values Dr. O’Loughlin proposes are the following:
- 90%-100%: acceptable performance
- 80%-89%: investigate performance
- Less than 80%: unacceptable performance
Step 4: Make the values visually distinct based on their scores
Next, Dr. O’Loughlin proposes creating a new rule in Excel that marks each added value with a suitable icon, to make the values and their scores visually distinct in the dashboard (e.g. you have an Efficiency value of 72 for Product A and you want to mark it with red to indicate it’s an unacceptable performance).
To create this new rule, do the following:
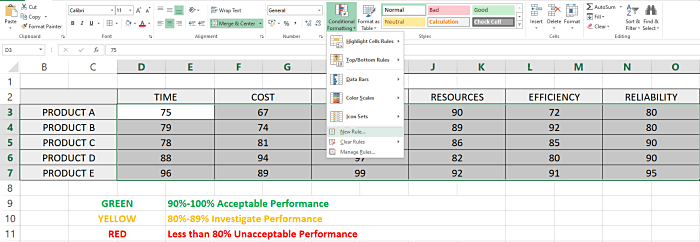
- Select the values you want to measure against the performance indicators in the KPI dashboard
- In the “Home” tab, go to the menu, and click on “Conditional Formatting” in the “Styles” group
- Select “New Rule” from the dropdown menu
- Once a new dialogue box opens, select “Icon Sets” in the dropdown menu that describes the format style for all cells, based on their value.
- Define the parameters based on the performance scores you defined above (acceptable performance, investigate performance, or unacceptable performance). Make sure it says “Number” as the type of the value.
- Define the green icon to appear each time a value in the dashboard is equal to or more than 90
- Define the yellow icon to appear each time a value in the dashboard is equal to or more than 80
- Once you’ve defined the green and yellow icons in the set, the red icon will automatically appear each time a value is less than 80
In the end, once you click OK, the appropriate icons will automatically appear next to each value in the KPI dashboard, making the values visually distinct, and thus easier to analyze.
Step 5: Draw conclusions from the KPI dashboard
With this KPI dashboard, you’ll be able to see at a glance whether some products are performing poorer than expected, based on their Time, Cost, Quality, Resources, Efficiency, and Reliability.
For example, Product A calls for extra attention, considering it has an unacceptable performance in 4 out of 6 KPIs (Time, Cost, Quality, and Efficiency), and a performance in need of investigation for 1 KPI (Reliability). Moreover, Product E is performing the best, considering it has an acceptable performance in 5 out of 6 KPIs you’re keeping track of (Time, Quality, Resources, Efficiency, and Reliability).
You can use this type of KPI dashboard for any number and type of KPIs and elements you want to measure them against, as long as you understand how you want to score the different levels of performance.
10. Review KPIs on a regular basis
Once you’ve fully defined your Key Performance Indicators, you’ll need to track your progress against them. This can be on a weekly, biweekly, or monthly basis, depending on the type of short-term KPI targets you want to track and measure.
Make sure you include the relevant teams in your company when reviewing KPIs. Go through the numbers together, draw conclusions, and provide and listen to feedback from the teams. If they mark certain KPIs as unattainable, think about how to approach this.
Before deciding to appease to the request to redefine the KPIs, think about whether your KPIs are completely unattainable or only challenging:
- On one hand, completely unattainable KPIs are failures waiting to happen (and will more than likely demotivate your teams in the process).
- On the other hand, KPIs that represent an interesting challenge are great to help the teams explore their limits, push their boundaries, and learn new skills.
11. Update your objectives and KPIs regularly
Last, but not least, you should always remember that KPIs are not, and should not be static — they’ll need to evolve, be updated, and change with your business.
In line with that, some of your KPIs will gain relevance over time.
Others will need to be scrapped due to becoming irrelevant from the moment you’ve set them until now.
As long as you keep reviewing, readjusting, and updating your KPIs in accordance with your performance and strategic goals of today, you’ll ensure you always have relevant KPI targets worth pursuing.
What are some examples of KPIs to use?
So, we’ve understood what Key Performance Indicators are, as well as what their benefits and purpose are, and, most importantly, how you can best set them. But, what are some examples of actual KPIs organizations track?
In the end, to help spark your inspiration, here are some KPIs you may want to track for your Saas company, as well as your marketing, sales, financial, support, and HR departments.
Examples of some SaaS KPIs you can track
- KPI: Monthly Recurring Revenue (MRR). Your SaaS company’s growth objectives in terms of recurring revenue happening on a monthly basis. (e.g. Target: $40,000 MMR).
- KPI: Quick Ratio. The growth of your startup when compared to the Quick Ratio (the ratio of revenue gains and losses) usually found in Balance Sheets. (e.g. Target: your quick assets in the amount of $ 50,000 / current liabilities in the amount of $10,000 = a quick ratio of 5).
- KPI: Net Burn Rate. The rate at which the startup uses up its venture capital when compared to the revenue it is generating on a monthly basis. (e.g. Target: overhead in the amount of $40,000 – recurring revenue in the amount of $10,000 = net burn in the amount of $30,000).
- KPI: Net MRR Growth. The rate at which your net recurring revenue is growing on a monthly basis. (e.g. Target: (March Net MMR in the amount of $5,000 – April Net MMR in the amount of $4,000) / April Net MMR in the amount of $4,000 x 100 = Net MRR Growth in the amount of 25%).
Examples of some Marketing KPIs you can track
In digital marketing
- KPI: The conversion rate. The conversion rate of leads, opportunities, and wins. (e.g. Target: 20%).
- KPI: The monthly revenue. This month’s revenue compared with the previous month’s revenue in terms of the size and growth rate. (e.g. Target: $80,000 revenue, 15% growth rate).
- KPI: Advertised Return on Investment (ROI). Conversion value and costs for all your campaigns. (e.g. Target: 50%).
- KPI: The monthly traffic sources. The sessions that were the result of organic traffic, direct traffic, and referrals during the current month. (e.g. Targets for sessions: organic search, 20,000; referrals, 10,000; direct search, 5,000).
- KPI: The monthly website performance. This month’s pageviews, new sessions, bounce rate, and the time spent on the website. (e.g. Targets: Bounce rate, less than 50%; Pageviews, 100,000; New Sessions, 30%; Time on website, 3m:30s).
In SEO marketing
- KPI: Keyword click-through rate (CTR). The frequency at which your pages appearing on the Search Engine Results Pages (SERPs) generate clicks compares to the number of times they appear. (e.g. Target: 5%).
- KPI: Content backlog. The number of content pieces that are waiting to be published (e.g. Target: 10 blog posts per month).
- KPI: Pageviews. The number of views individual pages on your website receive (e.g. Target: 1,000 per month on average).
- KPI: Link building metrics. The number of external links that are directing people to your website, and how many of those have the dofollow vs the nofollow attribute. (e.g. Target: 40 backlinks, 70% dofollow).
In Social Media marketing
- KPI: Social events. The interactions your Social Media activities get, from Twitter retweets to Facebook shares (e.g. Targets: 150 likes and 10 shares on average per Facebook post).
- KPI: Social sentiment. The type of sentiment (positive, negative, or neutral) your brand is getting across Social Media platforms. (e.g. Targets: positive tweets, more than 75%; negative tweets, less than 5%; neutral tweets, less than 20%).
- KPI: The followers growth rate. The number of new followers you have gained on all your Social Media accounts during a specific time period (e.g. Target: 20% rise per month).
- KPI: YouTube channel subscribers. The number of YouTube accounts that are following your channel and receiving notifications about channel updates. (e.g. Target: 5k).
In Email marketing
- KPI: Email subscribers. The number of users who subscribe to your emails (e.g. Target: 10k).
- KPI: Unsubscribers. The number of users who have previously subscribed to your emails, but have unsubscribed since (e.g. Target: less than 20 per month).
- KPI: Email forwards. The number of times your subscribers have forwarded your emails to their other contacts (e.g. Target: 20 forwards per month).
- KPI: Email Marketing engagement. The click and open rates of the emails you send as a part of an email campaign (e.g. Targets: Open rate, 50%; Click rate, 30%). Also, the list of key indicators in this area includes CAC, CPC, and CPM marketing.
Examples of some Sales KPIs you can track
- KPI: Sales Growth. The ability of your team to increase revenue during a fixed time period (e.g. Target: 30% growth per month).
- KPI: Potential new customers. The number of leads the team has contacted (e.g. Target: 500 in a month).
- KPI: Sales opportunities. The opportunity value of prospects based on the probability to close sales with them (e.g. Target: $70,000).
- KPI: Missed sales opportunities. The prospects you had but failed to contact (e.g. Target: less than 10% missed).
- KPI: Sales conversions rate. The success rate of your team to convert leads into customers (e.g. Target: 7%).
- KPI: Product performance. The sales for individual products ranked to identify the products that are selling well (and those you might want to discontinue) (e.g. Target: if a product brings less than $200 per month for 6 months, discontinue it).
- KPI: Sales per rep. The performance of individual sales reps in your team (e.g. Target: $1,000 worth of sales per rep).
- KPI: Sales by department. The performance of sales departments in your organization (e.g. Target: $10,000 worth of sales per department).
- KPI: Sales cycle duration. The time it takes to close a sales deal, from start to finish (e.g. Target: 1 hour).
Examples of some Financial KPIs you can track
- KPI: Current Ratio. The ability of your organization to cover all its short-term financial obligations within 1 year. (e.g. Target: total current assets in the amount of $150,000 / total current liabilities in the amount of $50,000 = current ratio of 3).
- KPI: Working Capital. The financial health of your organization according to your ability to cover short-term financial liabilities. (e.g. Target: total current assets in the amount of $150,000 – total current liabilities in the amount of $50,000 = a positive working capital of $100,000).
- KPI: Vendor expenses. Payments you owe to various vendors. (e.g $30,000 in total per quarter)
- KPI: Net Profit Margin. Your organization’s ability to generate a profit on each dollar of revenue. (e.g. Target: 15%)
- KPI: Gross Profit Margin. The profit you make on each dollar of sales, before the expenses. (e.g. Target: 60%)
Examples of some Support KPIs you can track
- KPI: Support requests. The number of support requests your team gets during fixed time periods. (e.g. Target: less than 500 support requests in a month).
- KPI: Customer satisfaction. The satisfaction level of customers who reach out to your team with support requests. (e.g. Target: 95%).
- KPI: Time per ticket. The time each support agent spends on a ticket. (e.g. Target: 15 minutes).
- KPI: Tickets handled on time. The number of tickets handled within a preset amount of time. (e.g. Target: 100 tickets handled in the targeted time of 15 minutes per ticket).
- KPI: Talk Time. The time spent on each support call. (e.g. Target: 5 minutes).
- KPI: Speed of Answer. The time needed to answer an incoming call. (e.g. Target: less than 20 seconds).
- KPI: Total number of complaints received. The number of complaints received that center around poor product quality or service. (e.g. Target: less than 5 per month).
- KPI: Queries resolved on the same day. The number of queries resolved on the same day they were received (e.g. Target: 90%).
💡 To track how much time you spend on your support activities, from calls to tickets, try our free time tracker Clockify.
Examples of some Human Resources KPIs you can track
- KPI: Headcount. The size of your department or organization. (e.g. Target: less than 10 per department, and 50 in the organization).
- KPI: Applicants received per Vacancy. The number of applicants you have received for each vacancy in your company. (e.g. Target: 20 per vacancy).
- KPI: Acceptance rate for job offers. The rate at which the job offers you make to prospective employees are accepted. (e.g. Target: 85%).